Laboratorio 6
ESERCIZIO XVI
Funzioni ricorsive
- Scrivere un programma che calcoli il fattoriale di un numero dato in input dall’utente. Il programma dovra fare uso di funzioni ricorsive.
- Scrivere una funzione ricorsiva che calcoli la somma degli elementi di un vettore dato in ingresso.
Soluzione
# Punto 1
def fattoriale(n):
    if n == 1 or n == 0:
        return 1
    return n * fattoriale(n-1)

num = int(raw_input("scegli un numero di cui calcolare il fattoriale:"))

print fattoriale(num)

# Punto 2
def somma(vect):
    if len(vect) == 1:
        return vect[0]
    return vect[0] + somma(vect[1:])
ESERCIZIO XVII
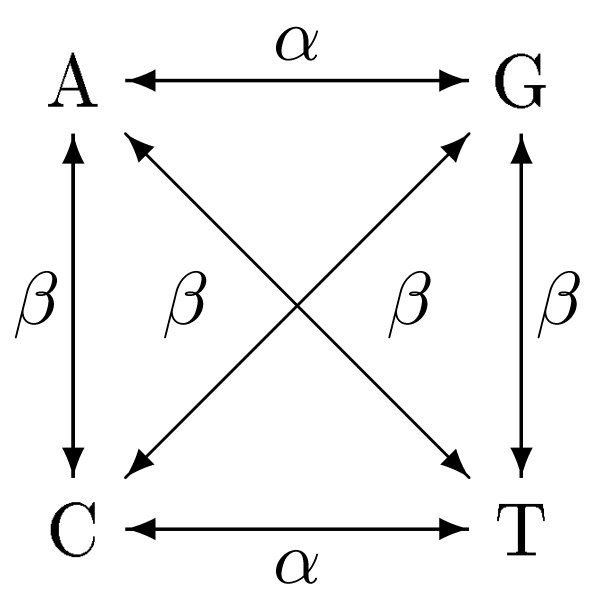
Si consideri un modello di evoluzione della sequenza del DNA basato su catene di Markov. Si faccia riferimento al modello definito da Jukes e Cantor, come mostrato in figura (si ricordi che per JK ). Wikipedia, Libro.
Codice fornito MarkovChain.py.
Alcuni esempi:
>>> nuc_mc = JC69('A')
<__main__.MarkovChain instance at 0x1a22066638>
...
>>> nuc_mc.get_state()
'A'
>>> nuc_mc.move()
'True'
>>> nuc_mc.get_state()
'C'
Utilizzado il codice fornito si:
-
Generi una sequenza casuale di lunghezza 100 nucleotidi; si generi un modello di Jukes e Cantor per ogni nucleotide, e si faccia evolvere la sequenza per 100 passi. Si stampi a video la distanza di hamming tra la sequenza originale e la sequenza evoluta.
- Generi una sequenza casuale di lunghezza 100 nucleotidi; si generi un modello di Jukes e Cantor per ogni nucleotide, e si faccia evolvere la sequenza per 100 mutazioni. Si stampi a video la distanza di hamming tra la sequenza originale e la sequenza evoluta.
-
Ripetendo l’esperimento definito al punto 2 per un certo numero k (es: k=10) volte, si stimi distanza di hamming media tra la sequenza originale e la sequenze evolute. Questo rappresenta un punto sul grafico in figura, dove k rappresenta il numero di mutazioni e c la distanza misurata.
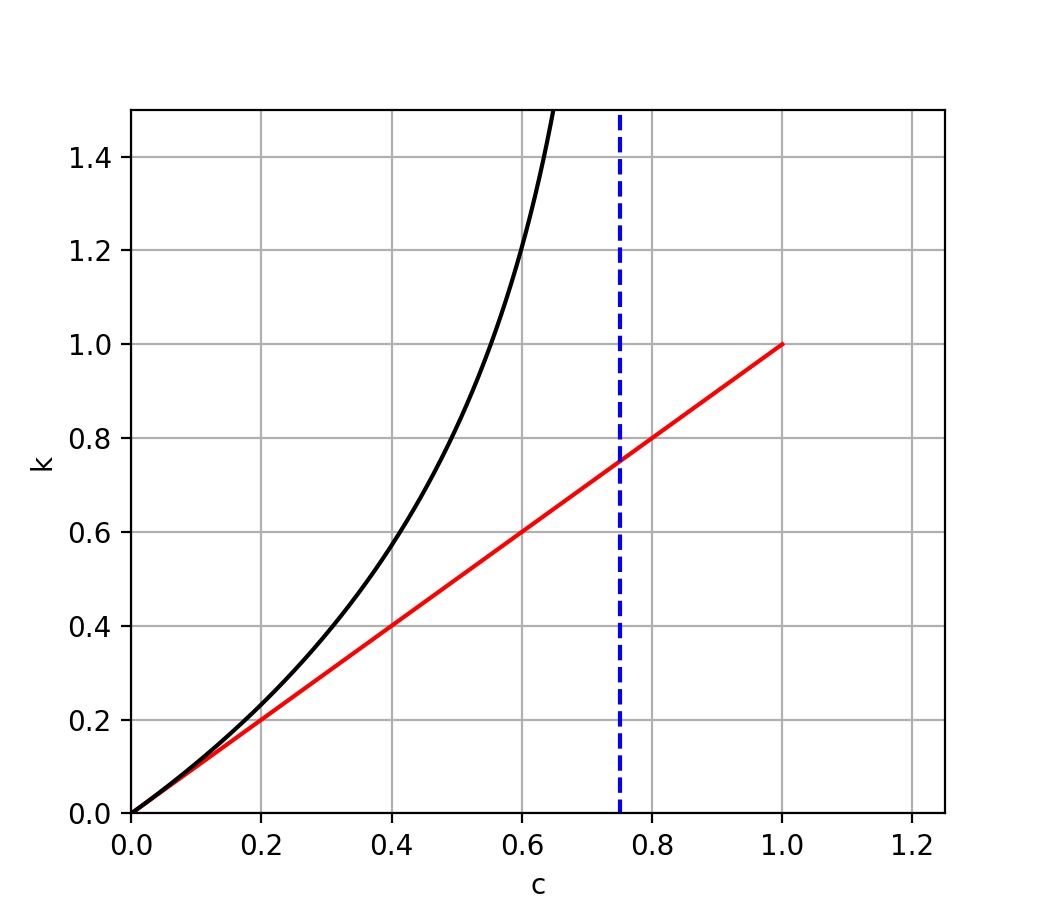
- Ripetendo l’esperimento del punto 3 per diversi valori del numero di mutazioni, si stimi l’intero grafico.
Soluzione
import random
from MarkovChain import JC69
import numpy as np


def hdist(s,t):
    d = sum(ch1!=ch2 for ch1,ch2 in zip(s,t))
    return d


length = 100
seq0= "".join([random.choice("ACGT") for x in range(length)])

print "initial sequence:\n"+seq0
print


#%%
# Punto I

num_steps = 100

models = [JC69(nuc) for nuc in seq0]

for i in xrange(num_steps):
    for model in models:
        model.move()

seq1 = ''.join(model.get_state() for model in models)

print "Hamming distance after %d steps:" % \
    (num_steps), hdist(seq0,seq1)
print


#%%
# Punto II

num_mutations = 100

models = [JC69(nuc) for nuc in seq0]

access_sequence = range(length)
random.shuffle(access_sequence) #all models accessed in random sequence

count_mutations = 0
while count_mutations < num_mutations:

    for i in access_sequence: #all models accessed in random sequence
        evolved = models[i].move() # remember: True -> 1, False -> 0
        count_mutations += evolved
        if count_mutations == num_mutations:
            break

seq2 = ''.join(model.get_state() for model in models)

print "Hamming distance after %d mutations: %s" % \
    (num_mutations , hdist(seq0,seq2) )
print

#%%
# Punto III

num_tests = 10

num_mutations = 100

results_list = [] #list to host test results

for k in xrange(num_tests):

    models = [JC69(nuc) for nuc in seq0]

    access_sequence = range(length)
    random.shuffle(access_sequence) #all models accessed in random sequence

    count_mutations = 0
    while count_mutations <num_mutations:
        for i in access_sequence: #all models accessed in random sequence
            evolved = models[i].move()
            count_mutations += evolved
            if count_mutations == num_mutations:
                break
    seq3 = ''.join(model.get_state() for model in models)
    results_list.append(hdist(seq0,seq3))

print "Avg Hamming distance after %d mutations in %d tests: %.2f +- %.2f" % \
    (num_mutations, num_tests, np.mean(results_list), np.std(results_list) )
print


#%%
# Punto IV

num_tests = 1

#num_mutations = int(length*3.1)
num_mutations = 100
#numpy array to host test results
total_arr = np.zeros((num_tests,num_mutations))

for k in xrange(num_tests):
    print "Test n.: %d for %d mutations" % (k+1,num_mutations)
    models = [JC69(nuc) for nuc in seq0]
    count_mutations = 0
    access_sequence = range(length)
    random.shuffle(access_sequence) #all models accessed in random sequence

    while count_mutations < num_mutations:
        for i in access_sequence:
            evolved = models[i].move()
            count_mutations += evolved
            if count_mutations == num_mutations:
                break
            if evolved:
                seq4 = ''.join(model.get_state() for model in models)
                total_arr[k,count_mutations] = hdist(seq0, seq4)


from MarkovChain import plot_gen

plot_gen(total_arr, length)
ESERCIZIO XVIII
Scrivere un programma che:
-
Dati due vettori, crei la matrice del prodotto . Ideare una struttura dati appropriata per implementare la matrice.
- Completare il programma con una stampa della matrice riga per riga:
[6, 7, 8 ... ]
[12 , 14, 16 ... ]
... - Aggiungere una funzione stampa_matrice(mat), che migliori la stampa:
stampa_matrice(mat)
6 7 8 9 10
12 14 16 18 20
18 21 24 27 30
...
Per fare in modo che i numeri siano stampati allineati, usare per ogni numero il costrutto di string formatting come riportato:
print '%3i' % num
Soluzione
import numpy as np

vector_1 = np.array([1,2,3,4,5])
vector_2 = np.array([6,7,8,9,10])

matrix = []


for elem in vector_1:

    row = elem*vector_2
    matrix.append(row)


for row in np.array(matrix):
    print row

print
# Soluzione list comprehension
matrix = [elem*vector_2 for elem in vector_1]
print np.array(matrix)


print


# Punto II
def stampa_matrice(matrix):
    for row in matrix :
        for num in row :
            print '%3i' % num,
        print
    print

stampa_matrice(matrix)